New about:telemetry page in Firefox 19
Firefox 19 now has a built in “about:telemetry” page which displays the data gathered by the “Telemetry” system. If the user has opted in, Telemetry will gather information about Firefox performance, hardware, usage and customizations and submit it to Mozilla. The information in the about:telemetry page is meant to inform users about the data being sent to Mozilla, but it can also help technical users report performance bugs to Mozilla.
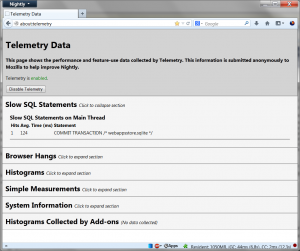
For example, the “Slow SQL Statements” section identifies slow SQLite operations which have caused Firefox “jank” (temporary hangs):
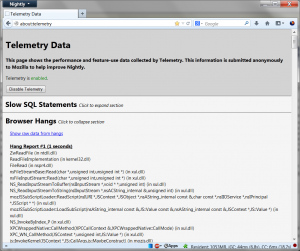
In Nightly builds which support profiling, the “Browser Hangs” section will show call stacks from the main thread whenever it took longer than 5 seconds to process an event. Clicking on “Fetch function names for hang stacks” converts the stack PCs to human-readable function names:
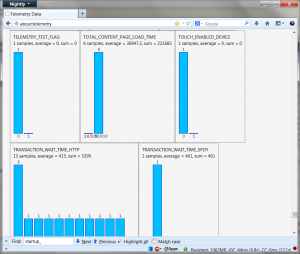
The Histograms sections contains various performance and usage measures expressed in histogram form. The histogram data is primarily intended for Firefox developers, but the brave can look up the histogram definitions in Histograms.json and compare their own values to the Firefox population using the Telemetry Dashboard.
I invite you to leave a comment or file a bug if there are any changes you would like to see made to the about:telemetry page to make it more useful for you.
Please note that the old about:telemetry extension has been obsoleted by the built-in page and that the extension is now marked incompatible with Firefox 19+.


