Looking at my own about:telemetry data
After I looked at Telemetry data from users with super-slow startups, I decided to take another look at my own about:telemetry page for comparison.
First off, there were 9 SQL statements on the main thread which required longer than 100ms to execute, as well as 46 slow SQL statements on other threads. This is a bit worse than usual for my about:telemetry page + a bit surprising since my machine is a recent i7 laptop with a 7200rpm drive, running on a “maximum performance” power profile. My first suspicion fell on a busy session restore period with 5 windows and ~50 tabs but my browser was not configured to actually load the pages in the background tabs on session restore. I took some comfort in knowing that most of the components which executed those main-thread queries are already being refactored to do async I/O instead.
I was also pretty surprised by the distributions found in a few of the histograms in about:telemetry. My CACHE_DISK_SEARCH histogram, which represents the number of milliseconds to search the disk cache (grouped into buckets), had a surprisingly long tail, with 11 cache reads requiring 100ms or more:
 (click for full size)
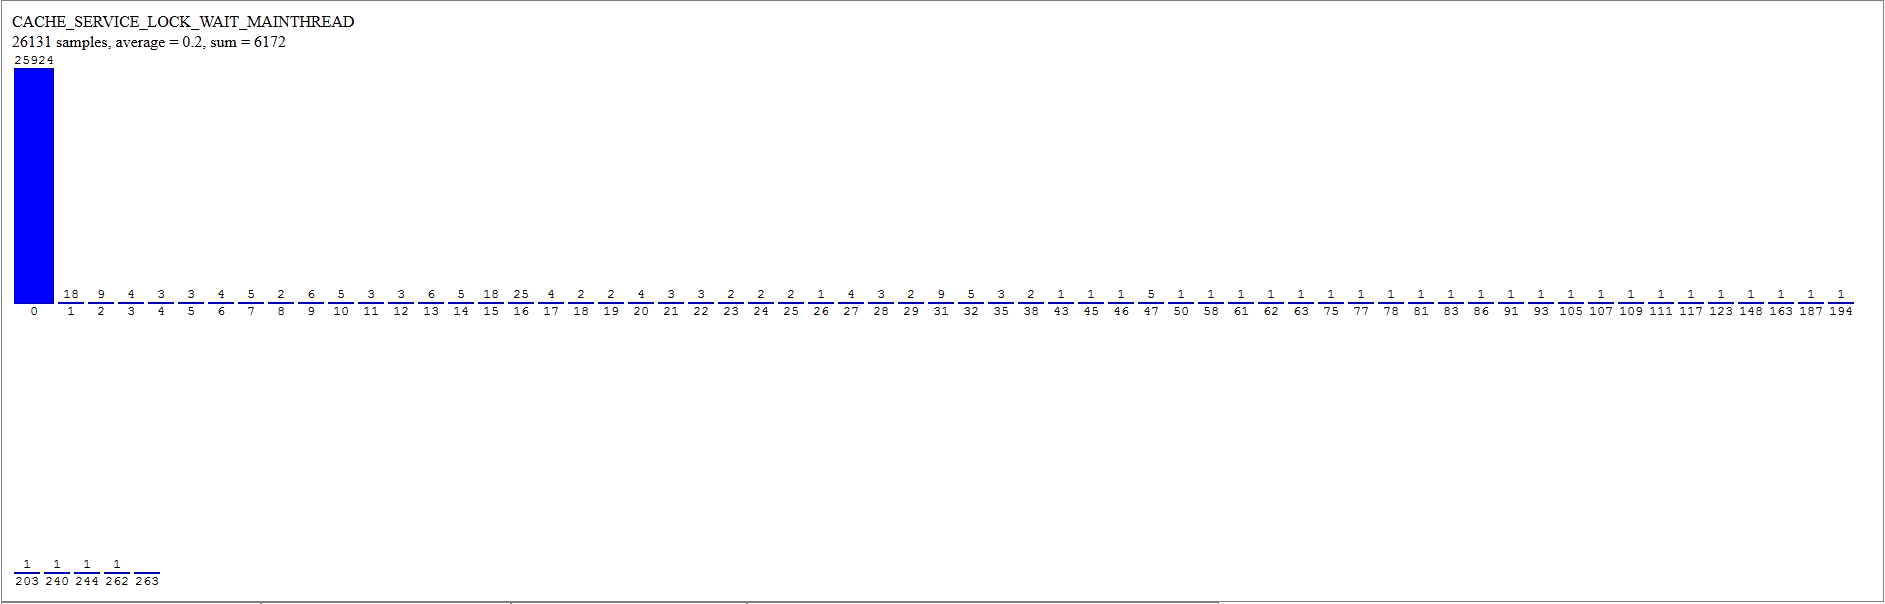
The CACHE_SERVICE_LOCK_WAIT_MAINTHREAD histogram was also concerning with a few dozen accesses requiring 100ms or more. I didn’t get a screenshot of the original very-long-tail histogram, but I do tend to see this kind of tail show up fairly often:
 (click for full size)
This is a known bug and a patch is getting reviewed in bug 722034.
GC_MS is also showing about half the GC operations taking more than 100ms, but incremental GC is going to be re-enabled soon from what I understand.
Finally, there was the issue of startup time. Startup always takes a few seconds on this machine if I’m restoring a big mess of tabs, but it felt extra slow this time so I took a look at the startup timestamps:
20ms main
1856ms createTopLevelWindow
2806ms firstLoadURI
4025ms delayedStartupStarted
4011ms firstPaint
4060ms sessionRestoreInitialized
4062ms sessionRestoreRestoring
4604ms delayedStartupFinished
6461ms sessionRestored
We can see a URI being loaded before first paint and adding up to 1.2 seconds to the startup time. I mentioned this in my previous blog post and I’ve filed bug 756313.
In general, looking at about:telemetry can be a bit daunting at first but it can really help narrow down sources of performance problems and give insight into how well the browser is performing in your specific environment. In the near future, we’ll have about:telemetry integrated into the browser (bug 661881) and with a makeover from the UX team, it will get a lot easier to extract meaning & file detailed bugs.